

GOLD MINING PROJECT
Geology Of The Target Area, Surrounding High Potential Gold Mines Production Results & Geo magnetic Results Of Power Pride`s Claims Showing Areas Of High Concentration Of Gold.
INTRODUCTION:
SILOBELA:

The survey site is located in Silobela district in the Midlands province. The district itself is host to a number of gold mines like Maligreen Mine, Peace Mine, Turtle Mine, Empress Mine and Leopard Mine now jointly know as Jena Mines. The area is known to be the host of hundreds of artisan miners actively extracting gold in the area.
The magnetic survey was carried out in a north south direction on 50-metre line spacing and 10m station spacing. This report does not include any geological mapping or work done, however if available and presented can be integrated with these results.
2. EXECUTIVE SUMMARY
A geophysical magnetic survey was conducted on claims in Silobela district in order to map the structural trends that are associated with gold mineralization.
The interpreted results show that there exist possible anomalies that can favor and influence economic mineralization.
Selected areas of the property host all three interpreted structures, thus faults and fractures, lineaments and either magnetic or alteration zones.
Induced polarization survey is recommended as a follow up to the magnetic survey results preferably gradient array on all the blocks then RSIP SECTIONS on selected lines obtained from the interpretation of the magnetic survey and gradient survey.
3. INSTRUMENTATION AND FIELD PROCEDURE
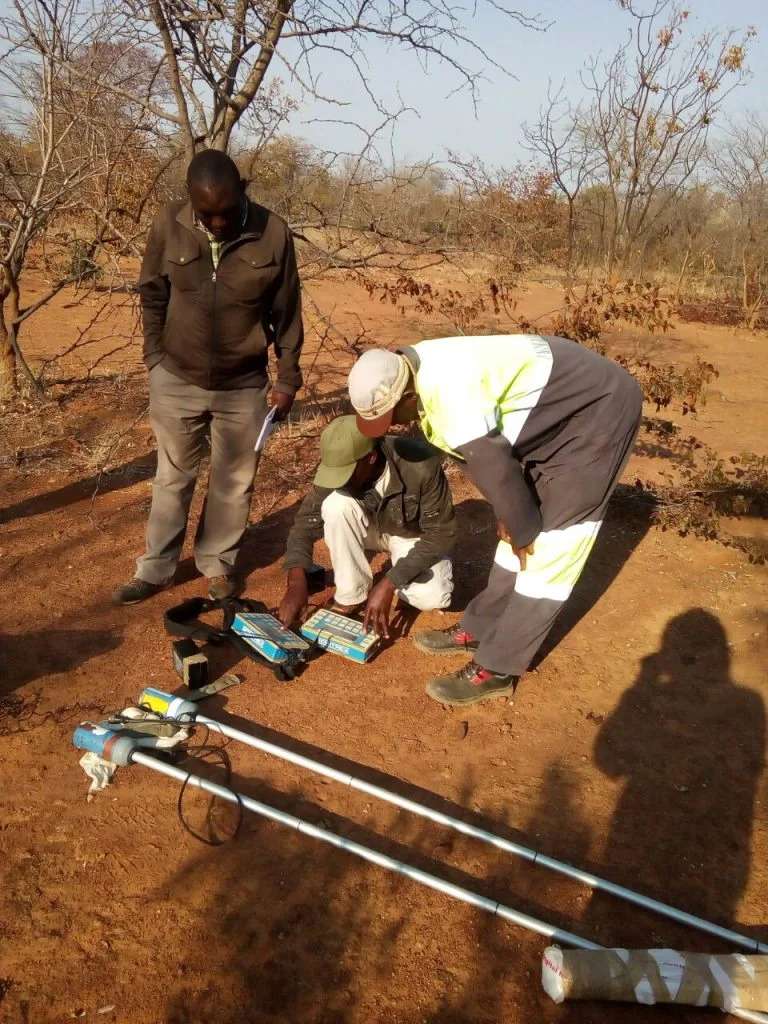
The survey was done used a GSM 19 OVERHAUSER Magnetometer which is 12V battery powered with an all metal housing for excellent electromagnetic interference (EMI) protection. The machine is capable of measuring the magnetic field with a resolution of 0.01 nano – Tesla and 0.2 nano Tesla absolute accuracies over it`s full temperature range.
4. BRIEF THEORY & SURVEY PARAMETERS
The Magnetic method measures the magnetic field as a result of the rocks at a specific station and is presented as a total magnetic field intensity map. The magnetic signature of rocks is rocks is due to a number of magnetic minerals such as magnetite it contains.
Some rock types (e.g. mafic volcanic) have a high magnetite content and create magnetic highs.
Other rocks low in magnetite (quartz, quartzite, and shale) produce magnetic lows. Faults are imaged due to magnetite destruction due to weathering, alteration during fluid flow through them.
Local magnetic highs may indicate the addition of magnetic minerals during electrical properties of the rocks in the survey area and are presented as chargeability and resistivity maps. The chargeability signature of rocks is due to the amount of electrical charge it can retain as well as how fast it can discharge that is it’s a capacitive effect of the rocks.
The resistivity method is measure how much the ground resist the flow of current. High chargeable and moderate chargeability zones with corresponding
moderate to high resistivity are the good targets for mineralization transportation and so provide exploration targets especially if the ore is associated with the magnetic material.
The survey parameters were chosen so as to extract as much detail as possible hence 10m station spacing.
5. PROCESSING AND PRESENTATION OF RESULTS
Special attention was taken to ensure that the mobile data readings were corrected for diurnal changes using reading collected at a particular point in the grid after a specific interval of time. The despiking and correction were done using GemLink a software for the GSM 19 machines.
The Geosoft software was used to filter, process and interpret the data. The data was presented as color plan maps and interpretation drawings. Enhanced images of the processed data have not been presented in the report for simplicity of the report.
RESULTS AND INERPETAION
The following figures show the different interpretations as obtained from different enhanced figures of the reduced to pole data after applying filters. The reduced to pole is used mainly because it allows for the viewing of the field as from its actual source position. The enhanced images and filtered grid images will not be presented as usually will cause confusion. The different interpretations are presented separately first so that one can easily appreciate their position and distribution in the grid or claim.
7. CONCLUSIONS AND RECOMMENDATIONS
The Magnetic method has managed to reveal more detail about the area. In this geological set up it is still not yet known which will be the primary targets, however, quartz veins are favored and have been found to host indicator minerals for gold mineralization.
Figure 11 above shows two distinct alteration zones which are worth investigating further. On the southern part, there exists a number of intersection points which are worth considering especially that on the boundary between the magnetic and alteration zones.
The northern end is definitely worth investigating as there are some fractures and faults that have been picked and especially those in the direction of the interpreted lineaments which are predominate.
The north south trend needs to be probed and preferably with an east west IP line on the selected area. These are contacts between rocks of different and varying properties and in most cases map the reefs within an area.
In conclusion, the magnetic survey has shown the existence of a network of structures worth pursuing. GRADIENT IP is recommended over all grids at 50m line spacing in order to map the electrical response of the mapped anomalies.
The Gradient array is a quick mapping tool to test the anomalies and as well give us the lateral trend thus allows zooming on the most interesting areas. Due to the lack of depth of the gradient array results and the complexity of the Real- section array, it is recommended that it can only be done on selected lines and infill lines in order to map the targets obtained in detail with depth and width.
It is considered that since the target mineral being explored is associated with sulfides then we should be able to detect it since it’s metallic and disseminated in nature.
In the event of limited resources RSIP lines can be done on selected points though there is an increased probability of missing the most interesting points.
If there exist points that have yielded good samples prior to this survey, please have them recorded and can plot them on the above interpretation map and see how they relate.
GEO MAGNETIC SURVERY RESULTS
Total Magnetic Field Map For Dambridge Block 1 (ATM NTOBE B)
The intense purple to red color shows the high-intensity value and the blue shows the lowest value.
The rectangle drawing on map shows the dimensions and position of the gold claim block.
Alphabet E represents position of the shaft, Dambridge block 2 has a shaft and belt at 28m, but has low gold values since depth is low. A geochemistry sampling of dumps was done.
The block is 10 Hectares in size, it can be extended.
Underground Exploration & Sampling Program
As part of the project’s ongoing grassroots exploration and mine development activities, underground shaft development was conducted within the Dambridge Block (ATM NTOBE B) target area to evaluate the continuity and mineralization potential of the identified gold-bearing structure.
During shaft sinking operations, the primary mineralized belt was intersected at an approximate depth of 16 meters below surface level. Following confirmation of the structure, systematic sampling was conducted at multiple underground intervals, including:
- 18 meters,
- 25 meters,
- and 28 meters depth,
to assess gold distribution, grade continuity, and recovery characteristics across the identified mineralized zone.
Collected samples were submitted for:
- Bottle Roll Cyanide Recovery Testing,
- and Fire Assay Laboratory Analysis
to evaluate both recoverable and total gold values within the ore body.
The underground sampling and laboratory test work form part of the project’s broader technical assessment program aimed at supporting:
- resource evaluation,
- future mine planning,
- metallurgical recovery analysis,
- and long-term project development.
The technical reports and laboratory results referenced below are available for investor review and technical due diligence purposes.
Dambridge Block 1 Gold Mining Expansion Projection
Shaft Development & Deep-Level Production Revenue Potential
This technical and financial projection outlines the estimated gold production potential associated with the continued shaft development of the Dambridge Block 1 mining section (ATM NTOBE B), currently developed to approximately 28 meters depth within a known gold-bearing structure in Silobela, Zimbabwe.
Current underground development and sampling activities have confirmed the presence of a mineralized belt returning preliminary assay values of approximately 0.29 g/t Au at the current shaft depth. The proposed expansion model evaluates the potential operational and financial implications of extending underground development toward the targeted 60-meter production horizon.
The projection explores possible production scenarios based on:
- continued strike and depth extension of the mineralized structure,
- increased underground ore access,
- improved mining continuity,
- scalable ore extraction capacity,
- and centralized processing through the planned Gravity + Ball Mill + Carbon-in-Pulp (CIP) Recovery Plant.
The report further evaluates:
- estimated ore extraction volumes,
- potential gold recovery outcomes,
- projected processing revenues,
- operational mining considerations,
- and long-term feedstock contribution to the broader integrated gold recovery operation.
The objective of the projection is to provide investors and strategic partners with a preliminary conceptual overview of the potential production upside associated with deeper shaft development and future underground mining expansion within the Dambridge Block 1 section.
All estimates presented within the report are preliminary conceptual projections prepared for internal investment evaluation purposes and remain subject to further geological verification, underground development, sampling, metallurgical testing, and technical feasibility assessments.
Total Magnetic Field Map For Dambridge Block 1 (ATM NTOBE D)
The intense purple to red color shows the high-intensity value and the blue shows the lowest value.
The rectangle drawing on map shows the dimensions and position of the gold claim block.
Alphabet D represents position of the shaft, it is just 8m deep. There is none geochemistry reports. Belt was not reached.
The block is 10 Hectares in size, it can be extended.

- (ATM NTOBE D) Dambrige Block 1 & (ATM NTOBE B) Dambrige Block 2 were discovered in Oct 2016 at Dambridge area in Silobela, Midlands Province in Zimbabwe through desk studies, area selection, land acquisition and preliminary community engagement for gold mining. Block 1 & 2 are 2km apart, with different belts.
- Furthermore, regional studies (geology, survey, geo magnetic geophysics) were carried out on grassroots exploration of geo magnetic survey for gold in Nov 2016.
- After when the survey was conducted, there was community engagement and the Zibagwe Rural Council involvement for approval to setup a gold processing plant. In Dec 2016, a letter of approval was issued out by the Zibagwe Rural District Council and payment was done.
- The gold mine documents certificate of registration were issued out in Sep 2019 at the Ministry Of Mines in Gweru under the Mines & Minerals Act.
- Mining operations started in Sep 2020, by sinking standard shafts at block 1 & block 2.
- At block 2, the belt was reached at the depth of 16m. Geochemistry 3 samples were conducted at Antech Laboratories in Kwekwe on Oct 2020 for dumps & rock chips. View the geochemistry lab results above.
- A tunnel was open at 18m following the belt up to 28m and then funds ran out to continue.
- At block 1, the shaft is 9m, no belt found.
- All the belts were traced from adjacent mines that are currently producing high volumes of gold through the geo magnetic survey.
Activities done on the ground for five claims:
Grassroots exploration
- Identify geological environment favorable for gold mineralization.
- Evaluate historical mining or exploration information.
- Recommend target areas for field reconnaissance.
- Regional geology maps.
- Geological bulletins.
- Community engagement.
- Desk studies.
- Area selection.
- Land acquisition.
- Geological survey and mapping.
- Geo magnetic survey (Geophysics) – 500m X250m / block.
- Gold processing plant license.
- Gold mining prospecting license.
- Gold mining license.
- Total size of land per block acquired – 10 Hectares.
Gold Belt Tracing & Geological Assessment
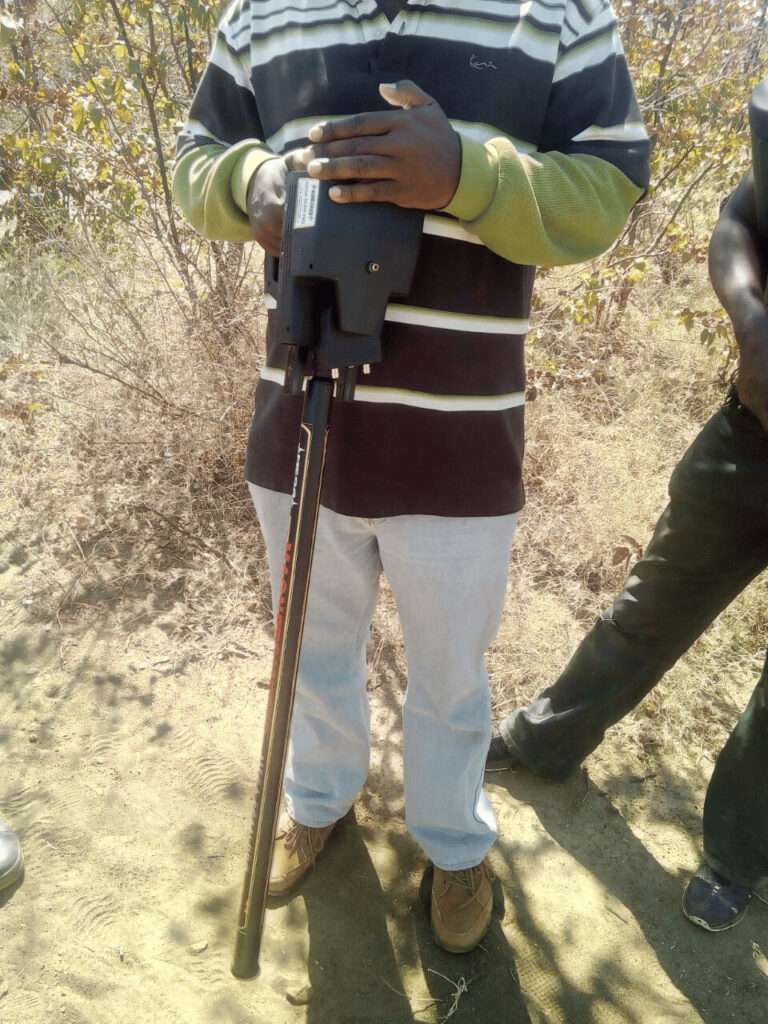
Geo-Magnetic Gold Exploration & Greenstone Belt Survey
African Gold Recovery conducted a professional geo-magnetic exploration survey using advanced Mega Detection technology to trace the continuation of a productive greenstone gold belt adjacent to an active mining operation.
The survey successfully identified structural trends, mineralized belt direction, and favorable target zones for future shaft sinking and underground gold exploration development.
This exploration program supports strategic gold recovery planning while reducing geological uncertainty and improving mining target accuracy.


